We all know it is good to recycle, right? But how good? Discover the surprising advantages of recycling that you’ve never heard before. From reducing landfill waste to conserving energy, find out how recycling can positively impact the environment and your daily life. If you want to see some recycling statistics in a great visual way, here are is an exclusive Recycling Infographic that shares statistics on the benefits of recycling. I have broken it down into 3 parts so that the images are easier to read and the statistics are more targeted.
3 Powerful Recycling Infographics:
Recycling offers a wide range of benefits for both the environment and society. By reusing materials like paper, plastic, glass, and metal, we reduce the need for raw resources, lower energy consumption, and decrease harmful emissions. Recycling also helps keep waste out of landfills and oceans, preserving natural habitats and protecting wildlife. Beyond its environmental impact, recycling supports local economies by creating jobs in collection, processing, and manufacturing. Embracing recycling is a simple yet powerful way to contribute to a cleaner, healthier planet for future generations.
Recycling Conserves Natural Resources Statistics In Visual Format
This infographic shows that one of the benefits of recycling is the conservation of natural resources. So not only does it lower the amount of waste, it also lowers the amount of new materials that need to sourced.
Recycling one ton of steel conserves 2,500 pounds of iron ore, 1,400 pounds of coal, and 120 pounds of limestone.
Did you know that the EPA estimates that recycling 1 ton of paper saves 17 trees and 7,000 gallons of water? Future generations will appreciate that your recycling efforts not only lowered greenhouse gas emissions but also left new raw materials for them.
When we recycle materials such as paper, plastic, and metals, we are essentially giving these resources a second life, rather than depleting them from our environment. The process of extracting and refining new metals requires significant amounts of energy and often involves environmentally damaging practices. By recycling metals, we can reduce the demand for new mining operations, thereby minimizing the impact on delicate ecosystems and reducing energy consumption.
Recycling Is Energy Efficient Infographic
The list of statistics for the benefits of recycling goes on…Just check out the infographic below for many more benefits of recycling!
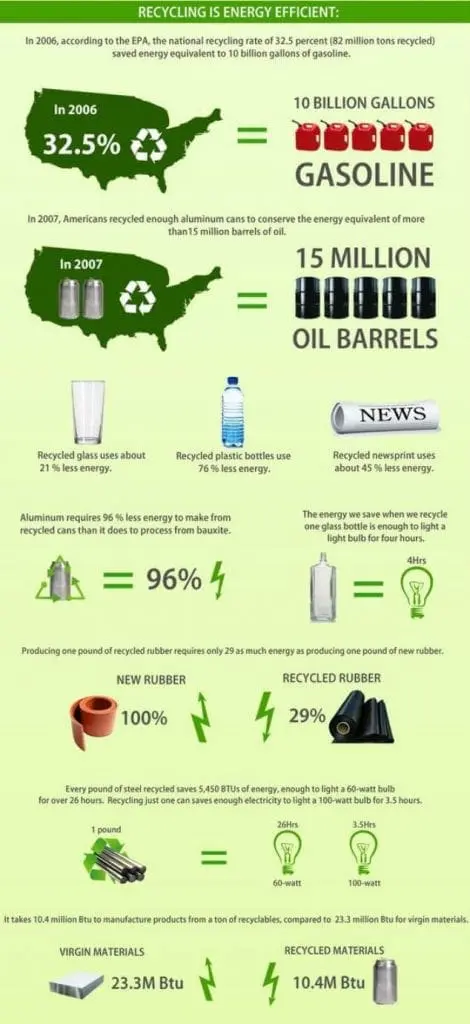
This infographic shows that recycling is energy efficient.
In 2006, the national recycling rate of 32.5 percent saved the energy equivalent to 10 billion gallons of gasoline.
Did you know that recycled plastic uses 76% less energy?
The process of manufacturing products from raw materials requires a significant amount of energy, often derived from fossil fuels. This energy consumption contributes to greenhouse gas emissions and further exacerbates climate change. However, by recycling materials instead of producing them from scratch, we can significantly reduce the amount of energy required. Recycling certain materials, such as aluminum cans, can save up to 95% of the energy needed to produce them from virgin materials. This energy savings not only helps to mitigate climate change but also reduces our dependence on fossil fuels.
By understanding the truth about recycling and its numerous benefits, you can make a significant impact on the environment and your daily life. Start incorporating recycling practices today and join the movement towards a more sustainable future.
Recycling Reduces Pollutants Infographic
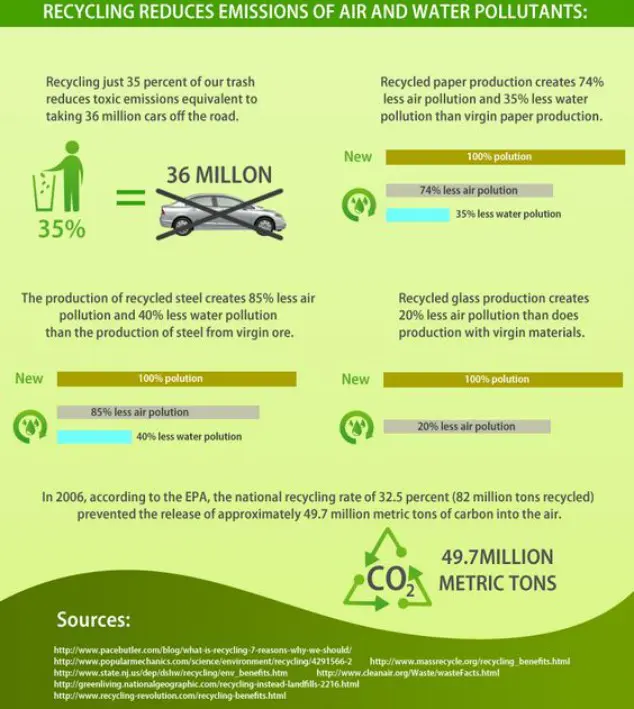
This infographic shows that recycling reduces emissions of air and water pollutants.
Recycling just 35% of our trash reduces toxic emissions equivalent to taking 36 million cars off the road.
Did you know that a recycling rate of 3.25% can result in roughly 49.7 million metric tons of carbon not being released into the air?
When we dispose of items in the trash, they end up in landfills, taking up space and contributing to pollution. However, by recycling, we are able to divert a significant amount of waste away from landfills, minimizing their impact on the environment and our communities.
Landfills are not only eyesores but also a significant source of greenhouse gas emissions. As waste decomposes in these sites, it releases methane, a potent greenhouse gas that contributes to climate change. By recycling items like paper, plastic, glass, and metal, we can decrease the amount of waste sent to landfills, thereby reducing the release of methane and other harmful gases into the atmosphere.
Moreover, reducing landfill waste through recycling helps us conserve valuable land resources. Landfills require vast areas of land, which could otherwise be used for more productive purposes, such as agriculture, housing, or recreation. By recycling as much as possible, we can alleviate the need for additional landfills and preserve the limited land resources we have.
Additionally, recycling significantly reduces the need for new landfills to be created. Building a new landfill is not only expensive but also poses environmental and health risks to nearby communities. By embracing recycling and minimizing our waste, we can extend the lifespan of existing landfills and delay the need for new ones, thus protecting our surroundings and our health.
What Can Be Made Out Of Recycled Materials? You’d be amazed!
The process of recycling aluminum, paper, bottles, and glass, has become a global effort.
- Businesses use much less energy than they would normally use to manufacture new products by reusing old ones.
- The world’s longest recycled bridge is in Peeblesshire, Scotland, and is made from plastic bottles and other plastic waste. It is 90 feet long and it can hold up to 44 tons of people, cars, or trucks. It’s truly amazing, and something we would not have even imagined just 20 short years ago!
- The upholstery in the 2012 Ford Focus electric car has up to 22 bottles in the seat fabrics.
- Paper products reinvent themselves into paper towels, copy paper and much more.
- Aluminum is mostly recycled back into cans, which by the way, uses 96% less energy than producing a new one.
- With today’s technology, recycled aluminum cans and steel can create tractor trailers and car bodies.
- Want a gorgeous garden? Composting is the process of recycling organic materials to fertilize and beautify your yard.
- TerraCycle enables the recycling on unusual items, such as wrappers, electronics, pens, & shoes! You can recycle and raise money for communities & schools at the same time.
- Outdoor furniture, kitchen counter tops, recycled plastic soap dishes, playgrounds and fighter jets are all made from your efforts to conserve, and there is no end in sight.
Conclusion
Recycling is a crucial step towards mitigating the negative effects of global warming. The importance of recycling can be seen its many environmental benefits. From Conserving Natural Resources, to Saving Energy, to Reducing Landfill Waste, to Mitigating Climate Change the recycling process saves valuable resources.
Did you know that recycling goes beyond protecting the environment? Yes, that is right. There are hidden benefits of recycling, including economic advantages and job creation. Rest assured that your recycling efforts contribute to a sustainable economy.Recycling creates job opportunities and stimulates local economies. The process of collecting, sorting, and processing recyclable materials requires a dedicated workforce. Recycling facilities and programs create employment opportunities for individuals involved in waste management, transportation, and manufacturing industries. These jobs not only provide income for individuals but also contribute to the overall economic growth of communities.
Your efforts make a huge difference. By diverting items from landfills, we can minimize pollution, decrease greenhouse gas emissions, conserve land resources, and avoid the creation of new landfills. Regenerating and reusing resources is not only changing the way we evolve as a nation, but ensuring our quest for a beautiful world. I hope these images were able to help you really see the benefits of recycling and hope we can increase our national recycling average more each year! What benefits of recycling struck you most from these recycling infographics?
Related Posts On Recycling:
November 15th is America Recycles Day: Don’t Forget To Recycle Cartons
Green Benefits Of Living In A City
Detrimental Effects of Plastic & The Positive Impact Of Recycling Plastics
Green Steve says
These stats are encouraging but I think that recycling should always looked at as a last resort rather than a solution. Use less and re use it, then recycle if need be.
Landfills require significant resources to operate and maintain, and their expansion can be costly. By diverting materials from landfills by using less, reusing, and finally through recycling, municipalities can allocate their resources more efficiently and reduce the financial strain associated with waste management.
By using less and recycling more instead of sending materials to landfills or incinerators, we prevent harmful pollutants from being released into the environment. Recycling helps reduce air and water pollution, creating cleaner and healthier communities for everyone.